How do we measure tree canopy?
|
The amount of tree canopy in a community is measured from aerial imagery, and described in a "percent of land covered" number.
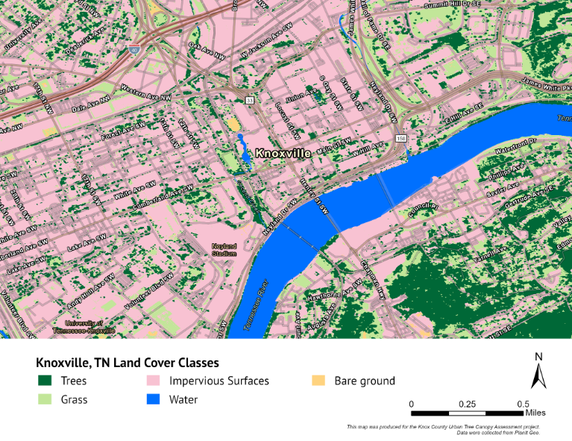
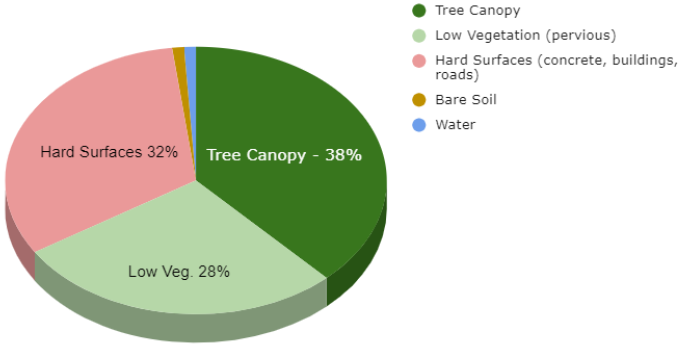
Tree canopy data is collected through a urban tree canopy (UTC) assessment. This is a computer-based analysis of the amount of covered by five land cover types - Trees, Low Vegetation (grass, shrubs), Impervious Surfaces (roads, buildings, etc.), Water and Bare Soil (usually agriculture fields or construction areas). In 2020, the City of Knoxville partnered with Trees Knoxville and other community organizations to conduct a comprehensive Urban Tree Canopy Study. The study focused on both Knox County and the City of Knoxville to look at changes in tree canopy between 2008 and 2018. The map at right shows a picture of the results of the UTC (land covers) in the downtown areas of Knoxville. This comprehensive review explored urban tree canopy in many different geographic scales including neighborhoods, census tracts, watersheds, and parks. The information used from this study will help guide planning processes for urban forestry moving forward. |
What should Knoxville tree canopy be?
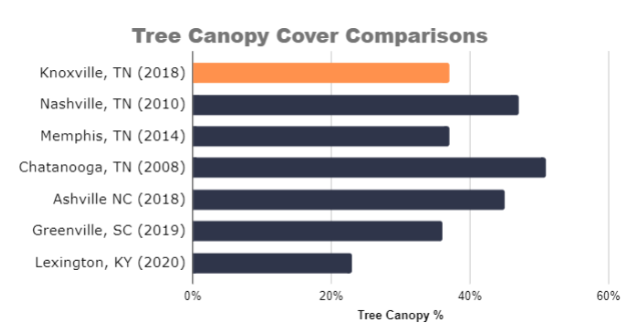
There is no standard quantity of tree canopy for every city, as every community is different. Communities differ in the number of people living there, how densely it is built, how much residential land there is compared to commercial and industrial, what the natural environment is like, and more.
Tree canopy data on nearby cities is provided for informational purposes only.
There is currently no tree canopy goal set in Knoxville.
Tree canopy data on nearby cities is provided for informational purposes only.
There is currently no tree canopy goal set in Knoxville.
Tree canopy in Knoxville neighborhoods.
How much tree canopy is there where you live? Is tree canopy equitably distributed across Knoxville? This is something that is important to examine, as trees play such an impactful role in Knoxville, lowering heat levels, providing cleaner air, better water quality and better human health (read more about the role of trees here).
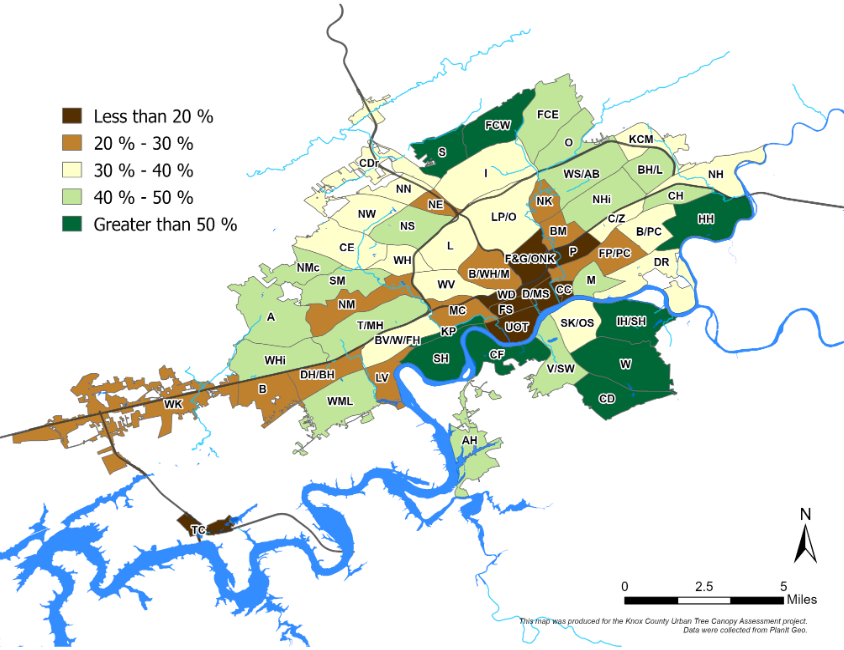
Tree canopy cover in Knoxville neighborhoods range from 5% to 63%. Of the 60 neighborhoods in Knoxville, 25 fall below the citywide average of 38%.
Tree canopy cover in Knoxville neighborhoods range from 5% to 63%. Of the 60 neighborhoods in Knoxville, 25 fall below the citywide average of 38%.
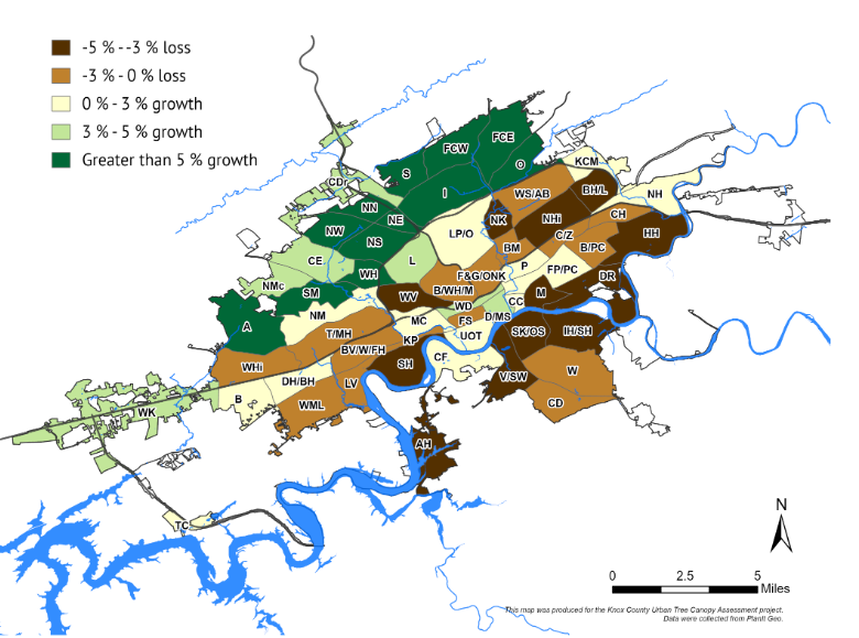
Change in Tree Canopy. The change in canopy between 2008 and 2018 can also be examined. Tree canopy gains occurred in 19 neighborhoods, losses occurred in 41 neighborhoods.
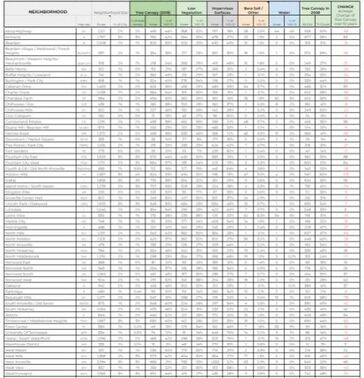 Land Cover by Neighborhood. Click for readable chart (PDF format).
How much tree canopy does your neighborhood have? The entire city of Knoxville has been measured for the amount of land in 5 categories:
So how much canopy cover is in your neighborhood? And how has it changed between 2008 and 2018? Click on the chart at right for a readable table (PDF) of land cover by the 60 Knoxville neighborhoods.
- Tree Canopy Cover
- Low Vegetation (everything green except trees - lawn, shrubs, fields, etc.)
- Impervious Surfaces (hard surfaces that repels rain - roads, buildings, parking lots, etc.)
- Water (lakes, streams, rivers)
- Bare Soil (usually construction sites, empty agricultural fields, quarries, etc.)
So how much canopy cover is in your neighborhood? And how has it changed between 2008 and 2018? Click on the chart at right for a readable table (PDF) of land cover by the 60 Knoxville neighborhoods.
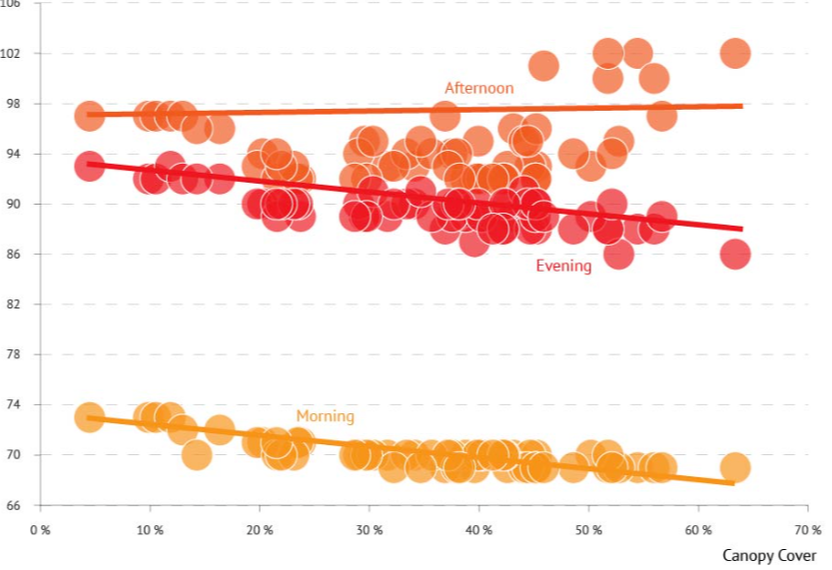
Is there a correlations between heat levels and tree canopy? Tree canopy data can be overlaid with the findings from the Knoxville Urban Heat Watch campaign in which local organizers and volunteers collected thousands of temperature and humidity data points in the morning, afternoon, and evening on August 27th, 2022. The chart below shows that areas of high canopy are 5-10 degrees cooler in the mornings and evenings. This is important to note, as heat levels have a direct impact on respiratory and other human health conditions. Considering that trees also remove up to 60% of the street level air pollutants (exhaust, dust, other chemicals) as well, trees have a significant impact on human health and must be available to every neighborhood.
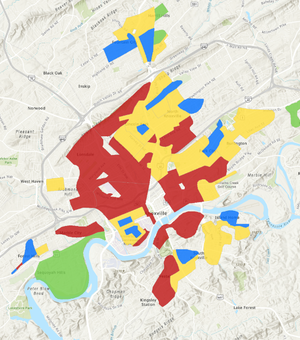
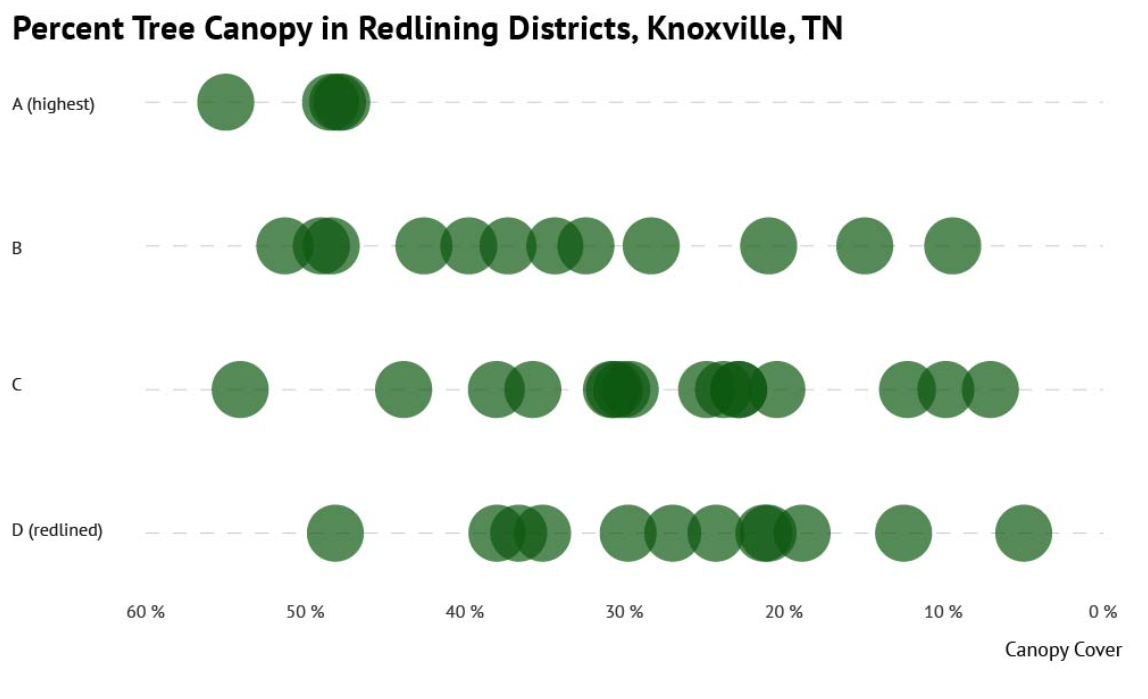
Impact of Redlining on Tree Canopy. Tree canopy is being examined by areas that were redlined in the mid 1900s (watch this UT video to learn more about the discriminatory housing and lending practices of the FHA and Home Owner Loan Corporation in general, and in Knoxville specifically). The chart below right shows percent canopy in each HOLC district, each dot represents a neighborhood. There were only three neighborhoods in the A category, and all have at least 50% canopy or more. The rating categories B through D have tree canopy covers that go as low as 5%. More analysis is planned.
More information on Knoxville Canopy
|
More analysis is planned for Knoxville's tree canopy, and will be shared on this website. Until then, below are resources to learn more on your own.
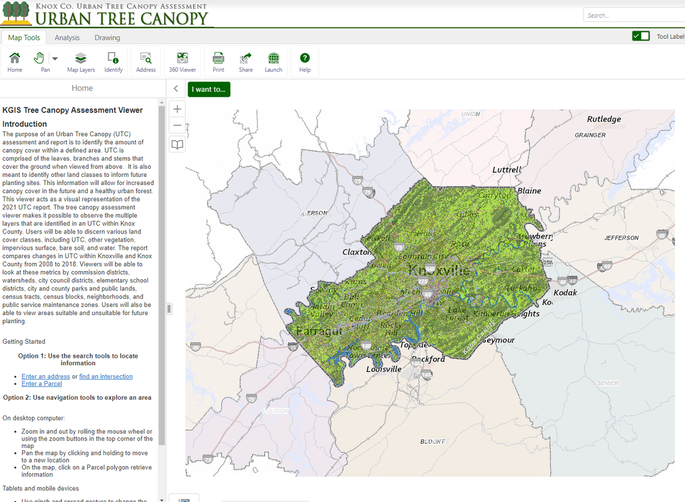
You can use this web-based viewer to explore tree canopy cover in Knoxville from the recent study. If that is too complicated or technical for your taste, you can view the full report in PDF format here and geek out to all things trees as much as you like. Two versions of the report were prepared - one that is county-wide, and the other that provides data on tree canopy just within the City of Knoxville boundaries.
|
We will be using the information from this analysis in this plan, and expect to have interesting facts and charts to share with you soon!

